In the previous post, we saw that Theo and Actual are unlikely to converge upon a single “true” value for individual players, during a practical evaluation timeframe used to make offers (i.e. 3 to 12 months). About half of your high-frequency players will have a gap between Theo and Actual of greater than 40%, making it very difficult to ensure your players are being segmented into the appropriate bucket.
A few readers may be thinking, “my casino uses ADW (Average Daily Worth), we combine both Theo and Actual into a single calculation, that should solve this issue!” Except it really doesn’t. Yes, ADW is closer to Actual than pure Average Daily Theo, but only by a little. In the table below, you can see that ADW is more likely than ADT to be within range of Actual, but the improvement is not that much.
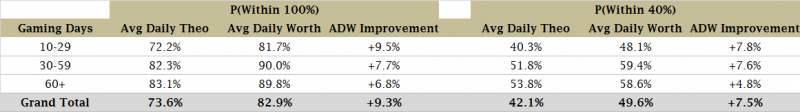
Look at the numbers in another way. Using pure ADT, 57.9% of my players will have a Theo-Actual gap exceeding 40% (1–42.1%). Using ADW, 50.4% will have a 40%+ gap. That’s a reduction of just 13% of outliers. ADW helps, but not a whole lot.
So if half of your players have ratings that can’t be “trusted,” and by that I mean that the two primary statistics that you pay attention to are telling different stories, how can you effectively evaluate your players and send them the optimal offer? Which do you prioritize?
It’s often stated that Theo is the more “pure” number, that it eliminates luck (which neither the casino nor the player can control) and measures how much revenue the player should generate given his/her volume of wagers and the house advantage. There are two problems with that assumption: a) Theo is still highly dependent on luck — when a player is winning, s/he can play much longer and therefore generate more wagers, and thus more Theo, and b) the player is primarily interested on his/her Actual win or loss, so that the casino is emphasizing a measure that does not reflect the player’s viewpoint of the success or failure of the gaming experience. When players have a really bad day and lose very quickly, not only have they had a bad gaming experience but in addition, the casino tends to “short-change” them as they don’t generate too much theo. ADW might help here a little but most ADW formulas only credit a player with 40% of his/her actual daily loss.
A better solution, instead of relying on one single calculation to drive an entire marketing campaign, would be to calculate multiple statistics for each player, compare them, and utilize the most relevant one(s) for each player. At a minimum, you can calculate ADT/ADW, plus ADA (average daily actual), cumulative actual loss and cumulative theo. Beyond that, you can calculate those same statistics after removing specific outliers (perhaps the player’s max win day, thereby not penalizing them for having a great day), you can calculate volatility (standard deviation, to see who plays similar amounts each day, and who is all over the map), and you can replace arithmetic averages with geometric averages (which will always return a lower value, assuming the inputs are all positive, like Theo or Worth). Further, you can make these calculations over multiple time periods and find out things like whether a player’s recent stats are significantly higher or lower than longer-term values (signifying an upwards or downwards change in play patterns) , whether a player’s actual loss is consistently much greater than his theo (indicating he may be a low-skilled video poker or blackjack player, for example), whether a player adjusts his visitation upwards after actual wins and slows down after losses (a potential measure of overall loyalty), among other things.
Without a doubt, things can get complicated quickly, and there’s no reason to add complexity without a clear improvement in the end result. But starting out by performing some tests can definitely guide you towards which statistics are most likely to influence player behavior. The alternative, and I’ve seen this at plenty of casinos, is to rely on a single, basic statistic (like ADW) for marketing efforts and to never attempt to adjust or improve. These basic stats have a built-in, quantifiable error rate (see the graphs and tables above), so it’s sub-optimal to be complacent.