When we analyze casino performance for a month, or a day, or even a single day’s promotion, we often look at both Theo and Actual generated. In the aggregate, the two numbers are usually reasonably close, similar enough to give an impression of whether that month or day or promotion was succesful. When they differ substantially, further digging often uncovers a handful of, or even just one, large players who either got very lucky or unlucky, and the size of their action heavily influenced the total Actual. Once these outliers are removed, the Actual and Theo usually come pretty close, in aggregate, for the remaining 98–99% of your guests.
However, when we send offers to our customers, each guest is evaluated independently, where his or her previous visits are the only data points considered. As opposed to an entire day, or promotion, where there are usually many hundreds, if not thousands of players to aggregate, reviewing a single player’s history over the past 3, 6 or 12 months leaves us with far fewer data points. And this leads to a dilemma — when Theo and Actual are wildly different, which should we prioritize?
At this point I imagine you saying, “ok, for the very infrequent guest, sure, Theo and Actual are probably pretty far off. But among my regulars, my high-frequency players, they converge. The math eventually catches up. I once sat in a seminar about this…”
I was curious how true this was. I had been investigating a group of players who had lost a lot of money, but who were bucketed in low-worth segments. The high number of these players surprised me. Evenutally, I ran some database queries to really test out this whole concept of convergence, focusing only on high-frequency players — at least one visit every 3 days:
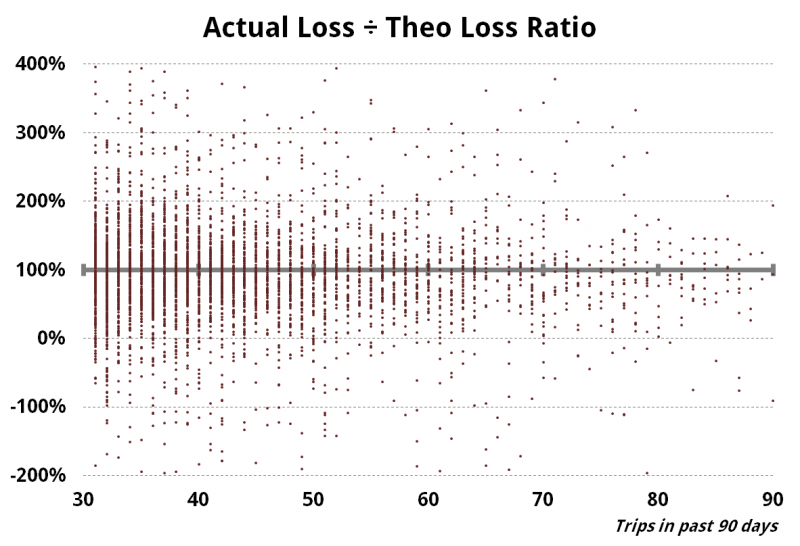
Each dot represents one player. Placement on the x-axis is determined by their number of visits in 90 days. The y-axis represents their ratio of Theo / Actual. 1.00 or 100% indicates that player’s Theo and Actual were identical. 200% means the player actually lost 2x his or her theo, and so on. A ratio below zero means the player was a winner. What is so surprising is how wide the distribution is — if Theo and Actual really converged as expected, nearly all the dots would be in a tight region right around 100%. And keep in mind the minimum number of trips in this data set is 30 (over 90 days), so it only covers highly-frequent guests. 95%+ of your customers visit less often, and are therefore even more likely to have a huge gap between their Theo and Actuals.
Eyeballing this chart, it’s clear that the number of outliers gets smaller as the frequency increases — making it appear that convergence increases as trip count rises. But this is partially an illusion — there are fewer outlier because there are far fewer data points in total in the very high frequency range. In this data set, the number of 30–39 visit players is 10x the number of 70–79 visit players. So that eyeball view is misleading, because what appears to be increased convergence is partially due to simply fewer data points. To get a better picture, I calculated the probability of a specific player’s ratio to be within 100% of true convergence (i.e. ratio between 0 and 200%), and then within 40% (i.e. ratio within 60 to 140%):

This is only a single data sample, but it appears to indicate that convergence doesn’t get significantly stronger until you get to 80+ visits. Until then, 15–20% of your guests will be outside a 100% window, and nearly half outside a 40% window. 40% would translate into a “true” $200 player being evaluated at below $120 or over $280. Depending on your offer matrix, that could easily be two, three or more segments.
Given this lack of convergence and the high error or volatility rate, how can we segment our customers correctly? If the data is unreliable, what can we count on? What can we possibly do for the majority of my players — who don’t visit anywhere near 30+ times per quarter? Which should I prioritize, Theo or Actual? Will Average Daily Worth, instead of pure Theo, help me?
We’ll try to answer some of these questions in Part 2...