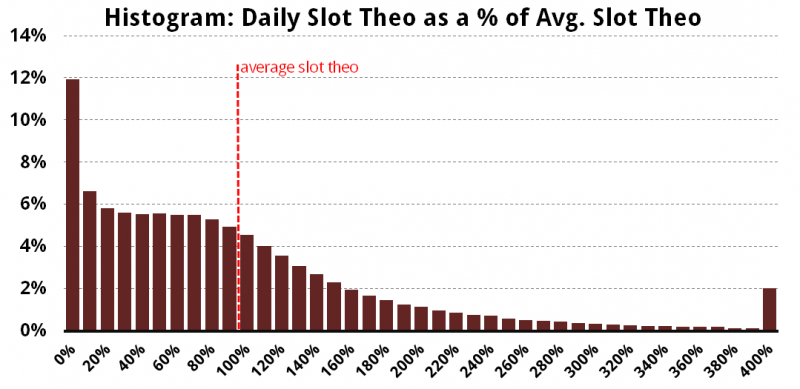
In Part 1, we introduced the skewed distribution of daily theo results, showing that players played well below their average on most days, offset by a handful of days significantly above their average — perhaps 2x, 5x or more. Here’s what that histogram looks like (note: the right-most bar at 400% actually combines all results above 4x average):
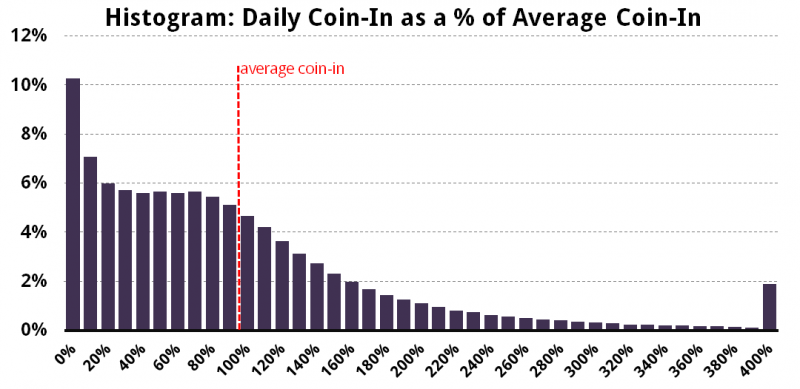
And not surprisingly, a raw coin-in graph looks almost identical:
But how about actual win? After all, that can go below zero (“negative win” is from the casino’s point-of-view, it’s when a player has a winning day). Well, I’d love to post that histogram here as well, but doing so would reveal certain sensitive statistics — like the exact percentage of players who actually have a winning day. Suffice it to say that from zero up, that graph looks remarkably similar to the previous two, with the addition of pretty normally-distributed probabilities to the left of the zero (representing player wins).
As nice as these histograms are, it’s still somwhat difficult to specifically quantify the likelihood of specific outcomes. Hopefully the following summary table will answer the most common questions:
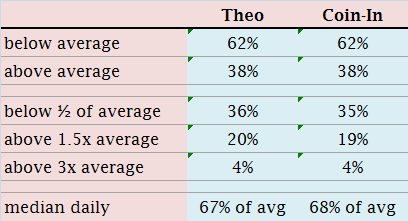
So, for example, a random player’s daily theo total will be under his/her average 62% of the time. The median percentage (the percentage at which half of trips will be above and half below) is only 67% of the player’s average. That is a huge departure from the 100% expected from a normal distribution, and a major impact if you’re designing a marketing program with the assumption that players generally play to their average theo — in fact, they play a full 1/3 less than that. Sure, a small number of customers should make up for that by having the outlier days and playing 3x, 4x of their average or more — but if your marketing program favors, say, a free room to a $250 player over a $200 cash customer (let’s forget about revenue taxes and other miscellaneous costs for the purposes of this comparison), you might find that the majority of those free rooms don’t actually generate the revenue that would have been locked in by the cash customer.