A presentation based on the concepts and ideas from this article was delivered to the San Diego Kotlin User Group in March 2021. Video of the presentation can be viewed on YouTube.
In Part 1, we attempted to evaluate whether existing NFL Win Probability models are useful and/or accurate. Proponents of the models, including their builders, claim that while not perfect, in most scenarios the margin of error is small, and much of their value comes from monitoring changes in WP, allowing observers to determine the degree to which a specific play, or series, increased or decreased a team's WP. I agree these are legitimate uses for general managers, coaches and play-callers. But the vast majority of the public only hears anything about WP in the context of a blown lead ("Atlanta had a 99.8% chance to win the Super Bowl!"), and the models are quite inaccurate at the extremes, often under-estimating the likelihood of a comeback by a factor of 2, 5, even 10 or more. Since WP models simply don't work at the only times the general public cares about them, I conclude that yes, the models are broken.
We can study the non-proprietary Win Probability models and start to identify reasons why the models feel big comebacks are so unlikely. The models all use historical NFL data, and from that, use a variety of techniques and formulas to forecast a WP for all in-game scenarios. This immediately leads to a clear problem: the NFL only plays 256 games each season (compared to 1230 in NBA, and 2430 in MLB), and in total, about 40,000 plays are run per season (vs about 185,000 plate appearances in baseball, or 220,000 field goal attempts in the NBA). When you combine all the combinations of field position, down-and-distance, time remaining, and point differential, you'll realize there aren't enough plays to cover all of the scenarios that might arise! Even after compiling stats from multiple seasons, and binning (i.e. instead of 100 distinct yard lines, 20 bins of 5-yard segments), lots of scenarios have very sparse historical data from which to learn. So any model builder starts out at a disadvantage when trying to predict NFL outcomes, compared with other sports.
Focusing specifically on scenarios where WP exceeds 90%, or 95%, amplifies the sparseness issue. Far more plays are run when a game is still competitive, than during a blowout. So there are far fewer data points available to train a model. And the data that does exist tends to suffer from a few issues:
- Historical data where a team's WP is very low (under 5%) is heavily skewed by bad teams. This isn't a surprise, what kind of teams tend to get on the wrong side of blowouts? Terrible teams. The following chart shows, from 2015-2019, the probability of trailing by 21+ points in the first half, by the total number of season wins. Therefore, when we get to the playoffs, or Super Bowl, and one team is way behind, the WP model is basing its forecast mostly on what very bad teams would do. In other words, when Patrick Mahomes and the Chiefs were down 10 points facing 3rd-and-15 at their own 35 and just 7 minutes remaining in Super Bowl LIV, WP models had to base their predictions (about 4% WP) on data from guys like Sam Darnold or Mitch Trubisky or Jameis Winston, because those guys often are losing late, while QBs like Mahomes aren't. The fact that the Jets or Bears are unlikely to pull out a win shouldn't apply to the Chiefs, who clearly have superior talent.
![[object Object]](data:image/png;base64,iVBORw0KGgoAAAANSUhEUgAAAo0AAAD4CAIAAAAGv0tBAAAVNklEQVR42u3dXYhc12HA8as2hJC2lOIkSJhsFlK3UCclhLJYbmMLtiUYArYbkcg2aa2XIkMi8iGCF/ril6zSKF/yg/yS2ASERaLEMnlIa1is+kXq1qZQUEtQGoSSxgqJKE1JIO2DOx87c87ce2Z2dndm7rl3f78XjWbu3D1zd3f+c+69M3vgjTfeKACALB3QaQDIlk4DQL50GgDypdMAkC+dBoB86TQA5EunASBfOg0A+dJpAMiXTpOH29879fD6ZnTF0XOvnLx7uvteO3vfExenWj65ZO9LF2svnHmgGF66I16ys8D5pTPTjib9RcsPaY9jnulm7z/iOax9p19t+EOwsnZ6af3J8Y96++/OHr9nkBGdJg8jT+H95+up2zSz5iU7stdO9u6/Uo7TXOs7vaw6vcNve096O2aydWEmdJo8lJ7Ch0+0Re/C0aMXL17sz0eHs9Ni2L5r0TJFmLZGU/TBosklJ82nX7jr2eE6PvGJ4umnR15KVJNTHl28m2CkG2PGHK1gcNVwUxzsf8m1pfX1i/Fdhl+jv7pKnhLbIbnZq8v1bz16tLh4cbN31a2t0a30rivirVp9iJWNMvle4f/dL3/8+sPxjHkwsK1rEt+d8MgqjyMxvnGPdbh1V9bOrW480d+sek+9dJo8TOx0tVl3Vy72lwlTsm7Vrh8f3hw/YyeWnLDfO1yKxrjdzLt8MT2f3tlIerf2e1mURrIZvYQpZeV2ajskNnuRWK4IX3H4eqh8Q5Eac1F+pFPdK55Pj27/m2O/J9vOp1OvwrZ5rP2LRdjmSk2tdJo8jNvvPfI8PPKfcI9bk5fpTZtWKkedh0s+dnPKTocvubK53Q7y0ugm7/eOp4fx5HZp5OsfTGVsJCRjd/eWt0N6s1eWGy1v3PnklghjHvNAt7lXstPFMNPJlW7X6coOg6XqlLryWNMvuKAmOk0eyueRje6pLj3N956zt+n06kZ3crkyGoU9dnrwTB8HdfQRjBvdVJ0+Vzwx2PMbbYRbI0kulyS+MhmV/iR7ZcyLi9IwS8slOl3+Viydvy8x5jGvXra5V5HodPjm7K7T0d708JX6X378Y9VpsqLT5GHcKUa7nU/3mlfe87nnTm+FunscuDLHm+18OrHk+E5PmE8n9wAnOt1L14Tj9cUU8+nRtfZedG19I6a6VzF2Pl0J5e7m0xO3iU6TLZ0mD1N1euLx6dEpWYhvmCgOjk+XJm9TH58ejnMzcUZWsZvj0zsaSbLT5aPbm6Xj06kJc6rToZy3SiMrnTSwMnaZOR6fLjf31tSdTpV428eq02RFp8nDdJ0ukicXj547PbLHvHvzysrK5mZ8tLu05Hbvnx6sKHre30xletLoxsyny2Oe5nzvckm2O987tR1Smz2x3MHyN2W6M7eT39vN7e+V7vSE872r353ygy7t+x7ZpuMfq06TFZ2GHVnsO453NJ55D02+oA46DdOatM+7RvGpUvMd2sjJfioNi6HTAJAvnQaAfOk0AORLpwEgXzoNAPnSaQDIl04DQL50GgDypdMAkC+dBoB86TQA5EunASBfOg0A+dJpAMiXTgNAvnQaAPLV7E4fONDs8QPAZM3unE4D0G7N7pxOA9Buze6cTgPQbs3unE4D0G7N7pxOA9Buze6cTgPQbs3u3Gw73VnTL3/5v7Md4Zve9BtvecubFr1dAGgLnQ5+8pP/ufPOL812hB/60B9897uPLHq7ANAWOh3oNAC50elApwHIjU4HOg1AbnQ60GkAcqPTgU4DkBudDnQagNzodKDTAORGpwOdBiA3Oh3oNAC50elApwHIjU4HOg1AbnQ60GkAcqPTgU4DkBudDnQagNzodKDTAORGpwOdBiA3Oh3oNAC50elApwHIjU4HOg1AbnQ60GkAcqPTgU4DkBudDnQagNzodKDTAORGpwOdBiA3Oh3oNAC50elApwHIjU4HOg1Abhbb6aunDxxe6/z74POvXzp2MHHr5SNvPHlP5+KtCw8deuTF3rXpZbdGr9MAtNoiOz3scKfCJ4pnRuq7Feb1K/1OR8meOHqdBqDVFtjpToqfW740mC4PLvZdvXBh+djyc4M4R9PpQbnTo9dpAFqttk6XJ9RFPIlOXeoP98CB0lp1GoAWy2Q+3ZPa2Z0u+nD05tMAtFoux6fH3D450zoNQMvVer53qcKp870nne2t0wC0nfdPBzoNQG50OtBpAHKj04FOA5AbnQ50GoDc6HSg0wDkRqcDnQYgNzod6DQAudHpQKcByM3Unbt29r4nLsZXHD33ysm76x69TgPQalN0rl/ocpZvf+/Uw+ubNddapwFot207d+3sqZuPnXngjrE3ny1O1lZqnQag3RyfDnQagNxM2bnK0ektK2svjJ9rL2D0Og1Aq03bue7h6OvHh8eit/67unHfs3fVWGqdBqDdpp9Pb6yOnDHWv6YT6tL1ix29TgPQalN2rn9292Av9/B/x68/bD49kU4DsBc76Vx0kLr3dqzO/2uttE4D0HbO9w50GoDc6HSg0wDkZvefG5rDJ4fqNADttoP3Txe1Z7k6ep0GoNV2/b6sLOg0AO22y885yYROA9Bue/ncUMent6fTAOyF870DnQYgN1P8Xcutzwc1n94NnQZgL8ynA50GIDc6Heg0ALnZyXlk9e/nroxepwFotd39HY7BH86qm04D0G676lz/71r2LtY7x9ZpANpt+s5FcQ7T6Zo/p0ynAWg3x6cDnQYgN1O+fzqzPg9Hr9MAtNr0n3OSY611GoB2275zyY/27ql/P7hOA9Bui/27lldPHzi81vn3wedfv3TsYOLWy0feePKe7Zccjl6nAWi1RX6+97DDty48dKJ4ZqS/nasOPfJisX6l1+lJS46MXqcBaLUFfm5op7nPLV/qTZeji31XL1xYPrb8XKjz2CVHR6/TALRabZ1OTJPjWfSYJTthLq1VpwFosWn2e485jWyn+723nSWP6bT5NAD71iL/XtZ2R53DeWSOTwNA12L/rmXpLO5ShZ3vDQCjpu1c9OneQ94/vT2dBmAvpn//9LN3vXBm6fzW26i3/l/337bU6b5r1352/vy/znadH/zg799//7vmPXIAJtvZ55wc7Myqrx/vzaKz+Nxvne779rf//ejRb852nZ/73Ora2p/Ne+QATDZl57q7vTdWXzizshn+XV+y33tbOg3AXkzfuWhK3TtQXf/RaZ0e0GmAtlrs+d4zH71O9+g0QFtNf3x675/vPYfR63SPTgO01S47l8VZZDo9oNMAbbXrzmVRap3u02mAttpt57o7wgv7vbel0wDsxe6PT9d/dFqnB3QaoK2c7x3odKwFnf761//ltdden+06n3rqyNve9ta6Hxmwj+h0oNOxFnT6Ix/51re+9W+zXecPfnDy3e/+vbofGbCP7OV9WX117v/W6T6dTtJpoAV28Pey1ou14R/euB0+6LvW0et0z1w7ffPmf3//+7dnu/L3vOcdhw799rw3i04DLbCzv8Nx96Rr6hi9TvfMtdNf+crVT33qH2a78m984+GPfeyP571ZdBpogWk719vxvbLW/1OW/b3gGZzwrdN9Op2k00AL7KBztwd/gaPI401ZhU4P6HSSTgMt4HzvQKdjOp2k08CCbdu5a2fPFifHz523uXneo9fpHp1O0mmgBaboXPpo9NZe8Hp3gOt0n04n6TTQAlN3rvIO6hwOUet0n04n6TTQAo5PBzodW0ynn3rqH8+d++fZrvw73/novfe+s9BpoBV0OtDp2GI6/ZnPvPSlL12Z7cpffvmvjxxZLnQaaIUpOhe9HyuHfd0jo9fpHp2OLabTly/f+PnPfzXblX/4w3904MBsVwk03radiz4hNJMPC41Hr9M9Oh1bTKfvvfdrV678eLYr//Wv//bNb/7N2a4TaLop3pcVPh+09CHf9dPpPp2O6TTQJjvtdF4Tap3u0+mYTgNtotOBTsd0OkmngQWbptM5/uXprdHrdI9Ox3QaaBPvywp0OqbTSTo9wa9+9X+dH8XZrnNp6Xfvv/9ddT8yqJNOBzod0+kknZ7gRz/6xdLSl2e7zgcf/MNLl47V/cigTjod6HRMp5N0egKdhnnQ6UCnYzqdpNMT6DTMg04HOh3T6SSdnkCnYR4W2+mrpw8cXuv8++Dzr186djC64daFhw498mLnwvqVN568J/p/Ytl49Drdo9Mxna6LTsM8LLLTnUpfPtLNcKfCJ4pnQn3D/weLDBfdZvQ63aPTMZ2ui07DPCyw050aP7d8qdfe6GLX1dMP3Xi8n+3+xSOXh9PprQn2mNHrdI9Ox3S6LjoN81Bbp+MJ9UinuxPpI5cH0+nSxPpA5c8J6XSh06N0ui46DfOQ53w6HI8u7yIvjd58ukenYzpdF52Gecjy+PTjNwb/n5xpnd6i0zGdrotOwzzUer53qPDY870nne2t0wM6HdPpuug0zIP3Twc6HdPpJJ2eQKdhHnQ60OmYTifp9AQ6DfOg04FOx3Q6aTGdPnz4a52fxhmu+e1vf+urr/7NbEdbpdMwDzod6HRMp5MW0+l3vvPLP/7xL2a45ne847d++tNTsx1tlU7DPOh0oNMxnU7S6Ql0GuZBpwOdjul0kk5PoNMwDzod6HRMp5N0egKdhnnQ6UCnYzqdpNMT6DTMg04HOh3T6aQWdPqOO/5utsN+3/sObmz8VaHTMB86Heh0TKeTWtDpAweemu2w3//+Q6+91n3Tl07DPOh0oNMxnU7S6SqdhrnS6UCnYzqdpNNVOg1zpdOBTsd0Okmnq3Qa5kqnA52O6XSSTlfpNMyVTgc6HdPpJJ2uWkynNzf/c3X1G7Nd+YkTf/KFL/zFbNcJM6fTgU7HdDpJp6sW0+nO1u5s89mu/OMfX3n66Qdmu06YOZ0OdDqm00k6XaXTMFc6Heh0TKeTdLpKp2GudDrQ6ZhOJ+l0lU7DXOl0oNMxnU7S6SqdhrnS6UCnYzqdpNNVOg1zpdOBTsd0Okmnq3Qa5kqnA52O6XSSTlfpNMyVTgc6HdPpJJ2u0mmYK50OdDqm00k6XaXTNXr55RuvvvqT2a7z0Uffe+edv1P3IyPQ6UCnYzqdpNNVOl2jT37y77/61X+a7TpfeeX4Bz6wVPcjI9DpQKdjOp2k01U6XSOd3g90OtDpmE4n6XSVTtdIp/cDnQ50OqbTSTpdpdM10un9QKcDnY7pdJJOV+l0jXR6P9DpQKdjOp2k01U6XSOd3g90OtDpmE4n6XSVTtdIp/cDnQ50OqbTSTpdpdM10un9QKcDnY7pdJJOV+n0ZD/84X9du/az2a6zs837H0Wi0/uBTgc6HdPpJJ2uakGnX3rpP06demm2K//0pw8//vj7Ohe++MUrM1/5+fN/+eij7y10en/Q6UCnYzqdpNNVLej0N7957aMfvTjblX/+83/+2c/+aaHT7NliO3319IHDa51/H3z+9UvHDkY33Lrw0KFHXuxcWL/yxpP3TFpydPQ63aPTMZ2u0ukknU7S6dwsstOd9l4+0s1wp8onimdCf8P/txYpxi1ZHr1O9+h0TKerdDpJp5N0OjcL7HSnuc8tX+rNlqOLXVdPP3Tj8X6MexefKU6MWbI8ep3u0emYTlfpdJJOJ+l0bmrrdDxNHul0Zyb9+vLpMUt2wlz3FgOAPdlReZs9n67LbOfxRm7kGWrosI3cyNs38mYfn65tqzXhW2vkmWjoyBs6bCM38vaNvNbzvUOFd3m+d21brQnfWiPPRENH3tBhG7mRt2/kDRhihhrxrTXyTDR05A0dtpEbeftG3oAhZqgR31ojz0RDR97QYRu5kbdv5A0YIgDsWzoNAPnSaQDIl07vWN6nok8x8OaNfDD808sNG/hwkw/ex9AUjfwhH3kXZ+UtJDmLR96sX9Phm22jh3LoxpP5b/J44Pn/mur0Dl3N/K3d2w+8cSPv6j/rNuKZKwif3xN9kk8TNPGHvP9cO/gJqXwkQ5bPvomRN+nXdOulUBy3/mPJNnfJgTfh11Snd2b8h6o1SL4/jmP0nrKePHbhdN7PWyXdzbx8zyOPdF+p5/7MNWr4o92Yn/FbFy7cOHbkxrBs5Y84zPfHpjzyIPOBF1cvXFg+tvxc9DKo9yLjSnE49xdGIwNvxK+pTu/M+A8pb4rm7T7emmIsN217d+cWxeAle+6TutTg15qx63Uo+o0s/8mAzLd99bmkKb+m1fn/jQZs73jgjfg11emdafZ8uinHjkYMDx71ZPuKNzXwYSua9Zou/Jg06wdmXKfznpaWRl4069c0PkTSPx+gJ/8XeFGnG/BrqtM71MRDd8ORN+IV+jiN2+Cjz2FNeeItSr3LdYYxedxNOj5dlLd4k35Nq5u3ERs8HmYTfk11escaeSps417uJh9BwzrdhBNJ08JPS5MG3oLzvRv3a9qCTjfh11SnASBfOg0A+dJpAMiXTgNAvnQaAPKl0wCQL50GgHzpNADkS6cBIF86DQD50mkgdu3sfc/e9cKZB+7Y+a23v3fq4evHXzl5956/DDCk00BsQZ0GpqTTkJtu7tY3u5dW1gZJ7PTxiYujV4XFwpXDxYqj57Z6GRbbuqpX06WjFy9eHFlu9Ev311i6b+nW8MW21lLudPT/7rLFucHFTuqPX3+4F/wiOZrE44D9SqchL6Nx21jd6uPG6jCcS910jYavfzFMdjvLrRdrWy29Oaxq71K3jJ0bR66LpsdhJYn73jG8NYypGF4syvPp4TC6FzaWVtdO9i92rls6f9+w0+XR3Ko+jrq/K1AfnYa8VHceR0lM7nge3qN6W7yywWpWNsPqEmsbKXH5vlFCi+pdKp0e3nLr7NlitXj25mPdr94r763oPuXR3HLsGgKdhuwM9/qG3clbO7j7RndCh6sq+63j3c3DDHY7PajppE6n7hsnNNrtvfX1qp3e2iWwunHq5mNrxfr5pTOrG/19BKm2j+wPGHkcsI/pNGQrEdaBeI6dOH1rcNXBMfPpaTo9eT4dV3z8fLp726mbq6sbG0tnThadi3ctrV/vZrqY3Ony43CEmn1MpyEv10ZmrKXj08NjxtHO6968tjufjqK83fHpaTo9+fh06PTt4RHmVKd7R6aLYrU/mFPP3lw6fiacTZYcTfRCwvFp0GnITupk5+p10c7xc8UTYQpcPlM8fb73+E73l0+e7z1ya7emW7umz61uPFGevY+sLzrhrPyVk68aUo8D9iudBoB86TQA5EunASBfOg0A+dJpAMiXTgNAvnQaAPKl0wCQL50GgHz9P/kWfS2f4On+AAAAAElFTkSuQmCC)
- Models don't account for how a team found itself trailing. In high-profile and playoff games, deficits tend to occur when highly unusual things happen, which aren't likely to continue throughout the games. But in the historical data, big deficits tend to occur because one team is simply better and is able to neutralize the other. When unusually negative things caused the deficit, we should expect that team to perform better going forward because those rare, negative things probably won't re-occur. On the other hand, when the deficit is caused by normal play, or when negative plays aren't unusual, then we shouldn't expect a team to improve and somehow overcome the hole it's in. A few examples:
- Super Bowl LIV was tied 10-10 at halftime, San Francisco built a 10-point lead in the 3rd quarter as both Chiefs drives in that quarter ended in Mahomes throwing an interception. Mahomes threw just 5 picks all season, and never twice in a single game. While winning the game wasn't certain, observers could be fairly confident that Mahomes's 4th quarter would be much better than his 3rd.
- Houston built their 24-0 lead over Kansas City in the Divisional Round with help from a blocked punt returned for a TD. They held Mahomes to just 1 first down in his first 3 drives, while the Texans scored 2 TDs and an FG on their first 4 drives, in addition to the blocked punt. Much of this was highly unusual -- a special teams TD, Mahomes's ineffectiveness, and also the speed of the early scoring. Houston went ahead 24-0 in the 21st minute. Of the 3 other games played that same weekend, the 24th point (both teams combined) was scored in the 29th, 30th, and 39th minute. Again, a repeat of a blocked punt wasn't likely, nor was Mahomes failures to generate first downs. No guarantee the Chiefs could overcome 24-0, but statistically, the last 3 quarters were vitually guaranteed to be much better than the first.
- Super Bowl LI, NE-ATL, 2 of New England's first 5 drives ended in turnovers (the other 3 were punts). LeGarrette Blount fumbled at the Atlanta 29. Blount had only fumbled twice all season on 299 carries, both back in September. Similarly, Tom Brady had only thrown 4 INTs all season (including the earlier playoff games), none of which were pick-6'd, but the Robert Alford of the Falcons returned his interception 82 yards for a score to lead 21-0. The Patriots needed a lot of things to happen to win the game, but fortunately for them, they were extremely unlikely to commit another 2 turnovers in the 2nd half.
- Contrast these situations with the five 16+ point blowouts in Week 3 of the 2020 season. The losing teams were Jacksonville, Las Vegas, Denver, the Jets and the Giants -- a combined 3-12. None of their opponents needed a special teams TD or a pick-6 to build a big lead. Sure there were plenty of turnovers, bu that wasn't unusual for these guys. It was Sam Darnold's 7th multi-INT game in 30 career starts. In Denver's case, they were down to their 3rd-string QB. Jeff Driskel and Brett Rypien's inability to overcome a 23-3 is now part of the historical data that will one day be used to calculate Win Probability for guys like Mahomes or Lamar Jackson or Russell Wilson.
- Of course, simply not repeating unusual mistakes isn't enough to ensure a victory. San Francisco reached Super Bowl LIV by crushing Green Bay, leading 27-0 at halftime. Aaron Rodgers fumbled a snap and threw an INT in the first half, and Green Bay only crossed the 50-yard-line once. ESPN calculated SF's WP at 99.6%. Rodgers was much more recognizable in the second half, leading 3 straight touchdown drives of 75, 75 and 92 yards. But the 49ers added points as well, and the Packers never got closer than 14 points.
- Most models consider only point differential, not each team's score. Real quick: who do you think is more likely to make a comeback, a team losing at halftime 21-0 or 35-14? Both are losing by the same 21 points. But the first scenario, where one team has failed to generate any points, we would expect that that team will struggle more in the second half than the team that already scored 14. Additionally, a low-scoring game naturally has fewer scoring opportunities, therefore the likelihood that the trailing team can generate enough points to overcome the deficit is lower. In a very simple model where we take the football skill out of the equation and replace it with coin flips, a team down 3 scores (i.e. 21-0) with 3 scores remaining in the game needs all 3 scores to go its way, which would result in a tie. Probability of winning is equal to getting 3 of 3 coin flips to land Heads, 12.5%, times 50% of winning the tiebreaker (i.e. overtime), or 6.25% overall. Now consider a game where a team trails 5 scores to 2 (i.e. 35-14) with 7 more scores remaining. There are 128 combinations of 7 coin flips. Getting 6 or 7 Heads will win the game outright, and 5 Heads will tie. P(6 or 7) = 6.25% and P(5) = 16.4%. In total, 6.25 + (16.4 / 2) = 14.5% chance of winning, 2.3 times more likely than when you need 3 of 3 in order to tie. Obviously real football games are far more complex, but this quick demo shows why simply using point differential, and not the scores of both teams, is not sufficient.
- Not all models include timeouts. A team's timeout inventory is essential to understand its ability to mount a late comeback. This is obvious to any casual viewer, as the ability to prevent an opponent from simply running out the clock potentially gives a team an extra offensive possession. On rare occasions even two, given the 2-minute warning and some clock mis-management by the opponent. Timeouts also increase the likelihood of success of a final offesnive drive, as the quarterback is not limited to sideline throws, the running game is viable, and the offense can simply run more plays if it is able to stop the clock.
- Models may use historical data that's too old. Points and touchdowns have been on an upward trend for the past 30 years, at least. The plots below, based on data gathered at pro-football-reference.com show both points and receiving touchdowns steadily marching upwards (we focus on Receiving TDs because of the emphasis on passing when a team is behind). Binning the years into groups of 5 removes anomalies, clarifying the upwards trend. Because NFL data is sparse, as discussed earlier, it may be tempting to use 10 or 20 years of data in order to solidify the data set. But as the binned graphs show, looking backwards more than just a few years is likely to include data that doesn't reflect the current state of QB talent, offensive aggressiveness, and the ability to quickly pick up large chunks of yards when needed. This is even more noticable when we repeat the analysis, focusing purely on passing efficiency statistics -- adjusted yards per attempts and passer rating.
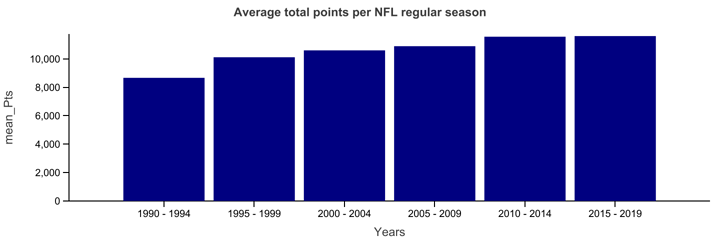
![[object Object]](/static/avg_rectd_binned-8b2a29a81901f6ecaaf717227706b28c.png)
Link to Jupyter Notebook used to create similar graphs of QB Rating and Avg Yds/Attempt.
- Finally, this is an observation, but from watching a lot of football for many years, it just seems that more strange things happen as the spotlight gets bigger, especially in Super Bowls. There's a combination of ultra-high pressure of win-or-go-home in every playoff game, players with a no-holds-barred attitude, and coaches who empty their bag of trick plays. I'm not sure Peyton Manning ever had the first snap go over his head for a safety, except for the Super Bowl. Sean Payton probably never called a surprise onsides kick, except in the Super Bowl. Although Mike Ditka loved to find creative ways to use William Perry on offense, only in the Super Bowl did he attempt a pass (he was sacked). Thurman Thomas never lost his helmet, except for at a Super Bowl. Both of New England's Super Bowl losses to the Giants were the Patriots' lowest-scoring games of the entire seasons. I admit to some cherry-picking here -- anything that happens in a Super Bowl game is obviously more memorable than just some random Week 6 where something unusual takes place. But just as some players succumb to the increased pressure, I think some coaches make more sub-optimal decisions in Super Bowls, which both causes unusually large deficits and then prevents a team from protecting its lead. In other words, all other things being equal, the probability of a blown lead in a Super Bowl is naturally going to be larger than the probability of blowing the same lead in a regular-season game.
While taking a look at the non-secret WP models, it does appear that some of these issues are starting to be addressed. The nflfastR model is the newest model I'm aware of, and it's open-source. It is an evolution of an earlier open-source model, nflscrapR. (Both are written in the R language, which is the reason for the 'R' flair at the end of the names). nflfastR is much newer than other models -- any that evaluated the New England / Atlanta Super Bowl are at least 4 years old. Brian Burke, now at ESPN, first published WP charts about a decade ago. Meanwhile nflfastR was first released publicly in April 2020, so we would expect that it attempts to improve upon inaccuracies in earlier models. From a post describing the composition of the nflfastR model, we can see it does include timeouts. The authors have also built an Expected Points model which includes home/away, which distinguishes historical data by "era", and even includes dome/outdoors. Hopefully these factors will soon make their way into the WP model as well.
Probably the biggest change modelers can make, especially when they are evaluating elite teams, is to recognize that historical data based upon weaker teams simply doesn't apply. Such data is more likely to introduce inaccuracy, rather than reduce it. We demonstrated above that the vast majority of historical data regarding the probability of large comebacks is based on weak teams' inability to do so. But elite teams, especially elite offenses, can. As an example, we can look at Brian Burke's tweet after the NE/ATL Super Bowl:
Since '01, teams down between 26 and 23 points with 6-9 min left in the 3Q were 0-190, now 1-191 (about .5% win rate).
��— Brian Burke (@bburkeESPN) February 6, 2017
This tweet demonstrates the difficulty of estimating a probability for something that had never occurred before. Whether past teams were 0-190, 0-19, or 0-1900, the historical data's win rate is zero. However, it's a mistake to assume that something cannot happen just because it has not yet happened. Statisticians would likely approximate the true probability using the "rule of three", arriving at a 95% confidence that P(NE comeback) < 3/190 or something under 1.5%. But if you throw out all the games where the trailing team was a sub-10-win team, you're left with only about 15% of the games, so the proper formula is closer to 3/28, which says our confidence window should extend from 0 to about 11%. Even some of that 15% can be filtered out -- games with a significant injury, Week 17 games where starters are resting, games where the trailing team did not possess the ball until well after that 3-minute window had elapsed -- and each time we do, it reduces the denominator in the "rule of three" formula, which further grows the confidence window of the true probability. We still don't have a definitive number, but the model is no longer restricted to assuming a value that must be under 1.5%, and is more likely to converge on a value in the range of 4 to 7%.1
Given the improvements we are able to see in the development of the nflfastR model, we're optimistic that its authors will re-calibrate it to increase accuracy at the extremes and reduce the current over-confidence. Most likely, world-class mathematicians will use much more sophisticated methods than the simple "rule-of-three" and other approximations. Unfortunately, however, this takes time, and ESPN and the NFL have a much larger audience than a small team of academics. Although the television network and the league will also probably refine their model, I have a feeling they will continue to mis-inform the public for a few more years.
Footnotes
-
I did not repeat Burke's study of games between 2001 and 2016, however I did look at all games from 2015-2019. 78 games fit Burke's parameters, a 23 to 26-point lead with 9 to 6 minutes left in the 3rd quarter. Except for the Patriots in the Super Bowl, none of the other 77 teams successfully came back to win. However, instead of assuming 1-77, rejecting all the games where the trailing team was not a 10+ win team left us with a 1-10 record (as in the example described in #1 above, the probability of weak teams falling behind is far greater than strong teams). A few of those games were affected by injury or player rests, leaving only 9 comparable games, or 12% of the original sample. Following this pattern is how we assume that instead of 190 comparable games, only about 15% or fewer of those 190 are actually a fair comparison. Jupyter notebook here. ↩