A presentation based on the concepts and ideas from this article was delivered to the San Diego Kotlin User Group in March 2021. Video of the presentation can be viewed on YouTube.
If you’re a fan of the NFL Red Zone Channel, you might have heard host Scott Hanson recapping multiple miraculous wins (and horrendous losses) early this season, where teams prevailed despite their opponent’s 98%+ win probability (“according to NFL Next-Gen Stats,” as Hanson attributes). If you’re a believer in grit, determination and "giving 110%," you might think these are terrific efforts by teams that refuse to die. If you’re a nerdy statistician, you’d think instead, the NFL’s win probability model must be way off!
The Falcons had a 99.9% win probability against the Cowboys and lost.
— Jordan Heck (@JordanHeckFF) September 27, 2020
The Falcons had a 99.6% win probability against the Bears and lost.
Back to back weeks. pic.twitter.com/RoBag3lnHU
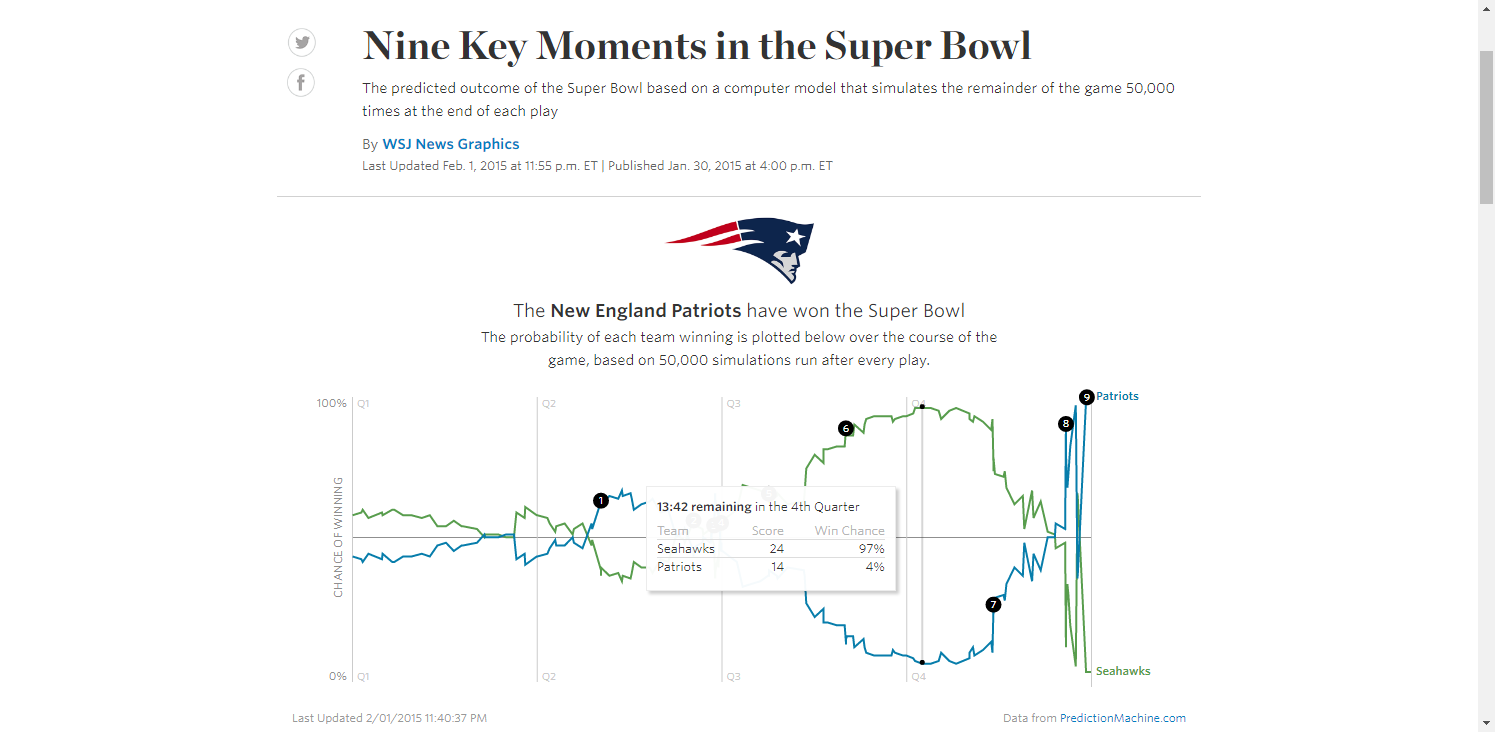
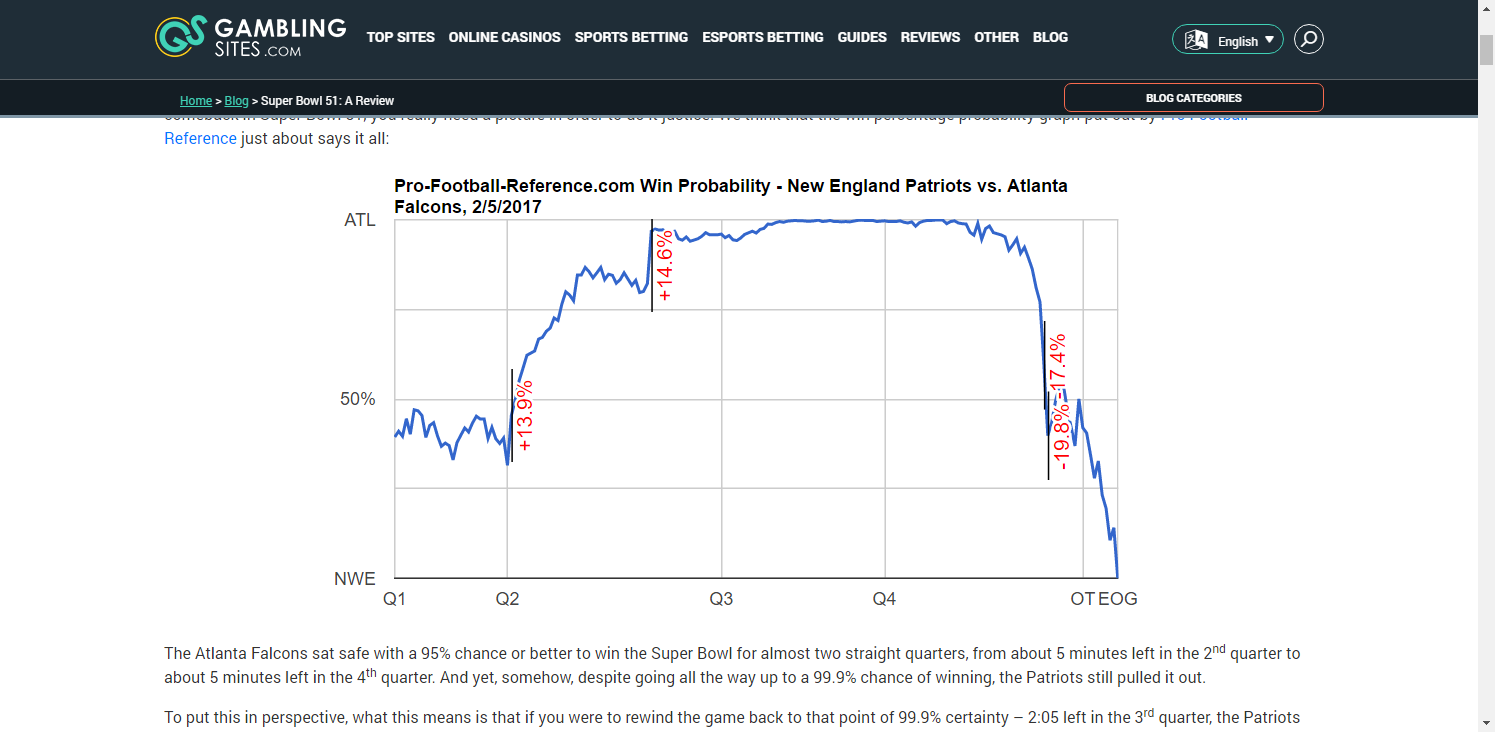
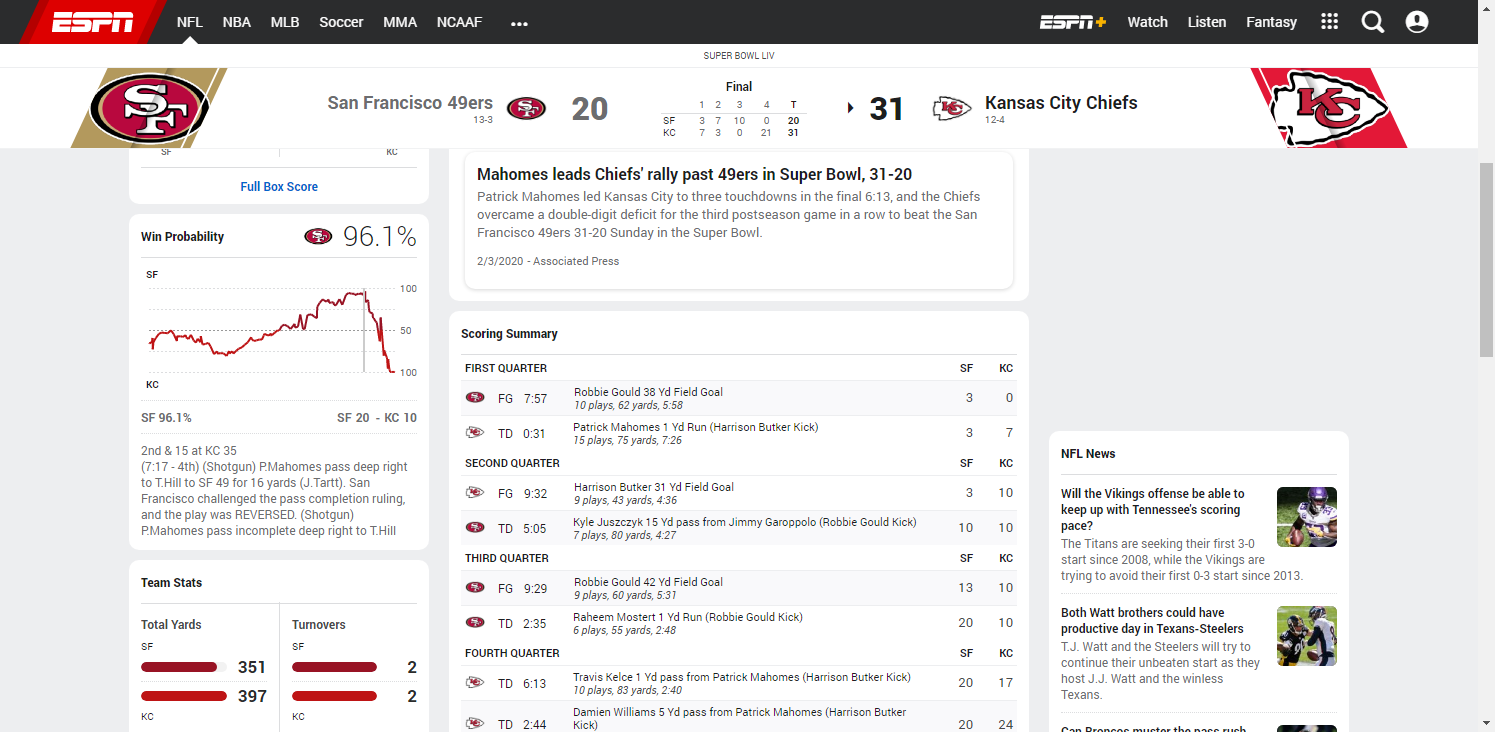
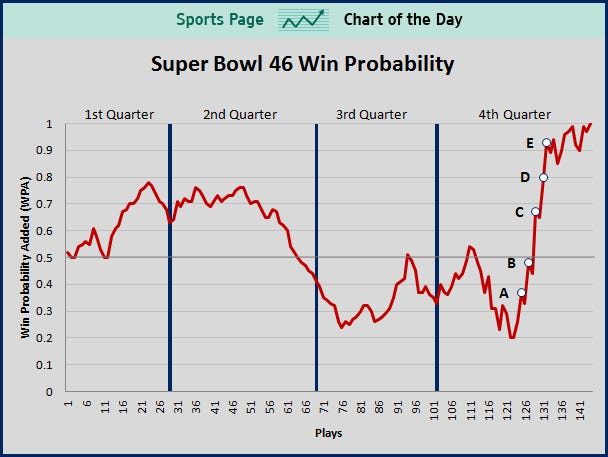
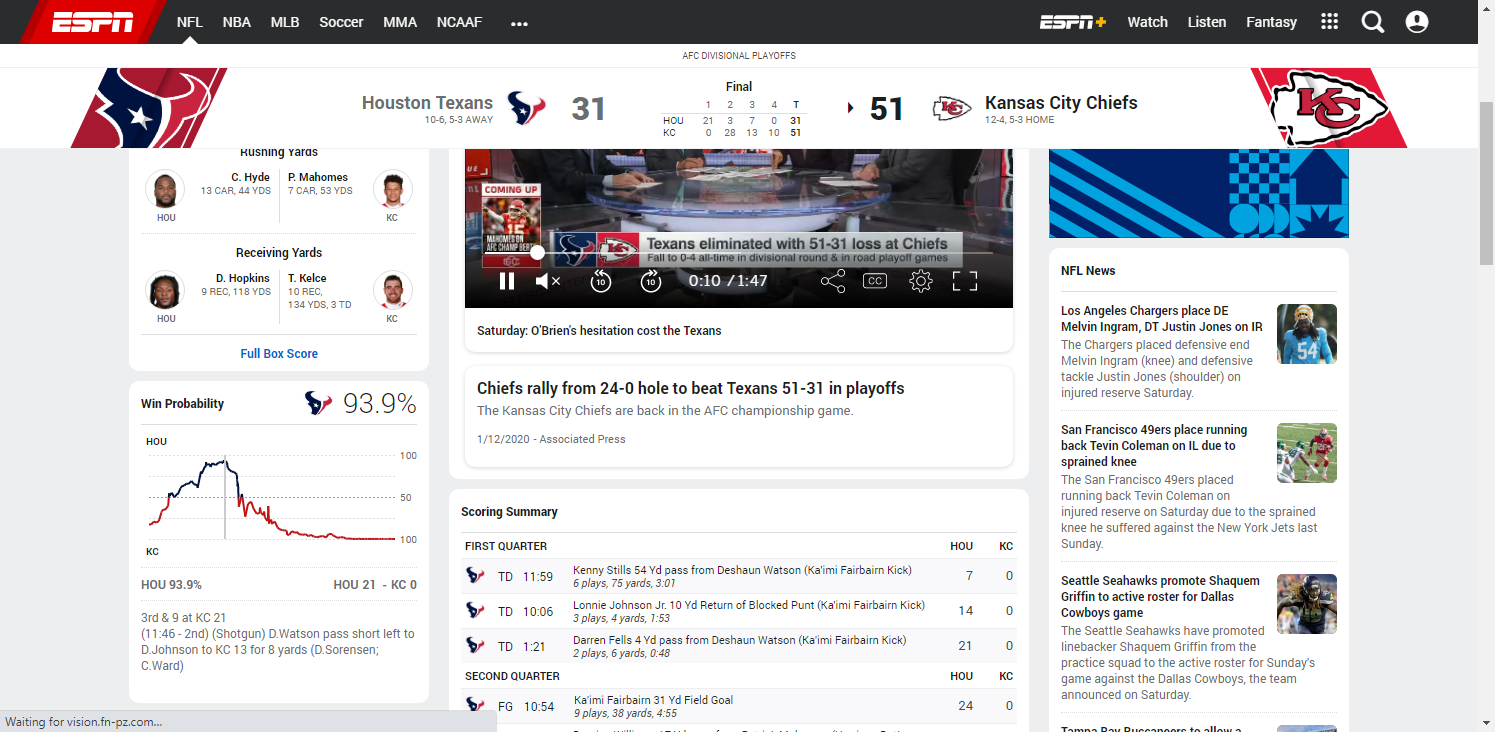
In the 10 Super Bowls contested in the 2010s, 3 teams prevailed after their win probability fell below 4% (New England vs Seattle1, New England vs Atlanta, Kansas City vs San Francisco), and another won after its WP had fallen to 20% (New York Giants vs New England). Just last year, champions Kansas City trailed significantly in all 3 of its playoff games, with its opponent’s win probabilities peaking at 93.9% (Houston, Divisional Round), 61.4% (Tennessee, AFC Championship) and 96.1% (San Francisco, Super Bowl LIV).
Given so many “unlikely” comebacks, it certainly seems that the actual probability of winning is quite a bit lower than what gets spit out by these win probability formulas, especially when elite teams are involved. Why is this? Why are the models so overly confident? Can their accuracy be improved?
Let’s start out by stating that this isn’t the first time the accuracy or usefulness of win probability model have been questioned. The best analysis I’ve seen was written by Michael Lopez, where he compares 6 distinct models: Pro Football Reference, ESPN2, PhD Football, nflscrapR, Lock and Nettleton, and Gambletron 2000. We can categorize these models, plus another half-dozen I’m aware of, by level of transparency:
- PhD Football (NFLWin)
- nflscrapR
- nflfastR
- Lock & Nettleton
- Pro Football Reference
- Gambletron 2000
- ESPN/Brian Burke
- NFL NextGen
- Prediction Machine
- numberFire
- Massey-Peabody
- EDJSports
Are the models actually flawed?
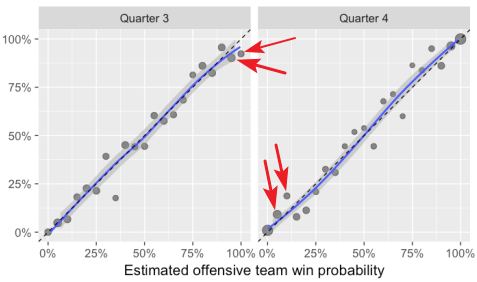
An important concept in statistics is understanding that “anecdotes aren’t data.” That is, just because we can recall a handful of high-profile games where the models were overconfident, that doesn’t mean they are statistically unsound when measured over a full season, or decade. Lopez attempts to measure the model's forecasting ability by reproducing the Lock & Nettleton model over the entire 2016 season, then plotting the predicted win probability against the actual results. And on casual inspection, it looks pretty good! There aren’t many data points, except in the first quarter, where the predicted WP doesn’t match up with the actual WP.
So are we being overdramatic? Are we taking a few mistakes out of context? No, I don’t think so. And here’s a list of why I maintain that the models are seriously flawed:
- The only time most people care about Win Probability is when a team blows a 90+% WP lead. You simply don’t hear about WP when a team favored by, say, 70% loses. Perhaps a GM or coach evaluating players (or maybe the OC’s play calls), or sportsbook operators3 and bettors, are interested in WP and WPA throughout entire games, even when the game is relatively close. But for the vast majority of football fans, the only time WP ever enters the conversation is after a team at the extreme end reverses their fortune (i.e., New England coming back to beat Atlanta in Super Bowl XLIX).
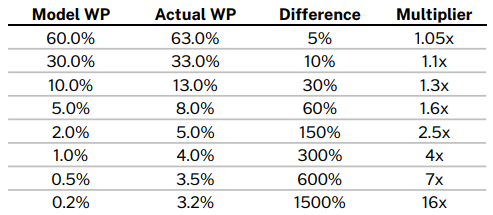
- Compounding the importance of the extreme ends of the model, the effect of small nominal errors is greatly amplified the closer we get to 0 or 100%. To demonstrate: assume our model underestimates the defensive team’s WP by about 3 percentage points. In a reasonably close game, where the model says the defense’s WP is 60%, but is actually 63%, the difference between the model and reality is 5% (.63/.60 - 1). If the model says the defense has 7% WP, but is actually 10%, the model is off by 43%. If the model says the defense has just a 1% WP, but is actually 4%, the actual WP is fully 4 times larger (300%) than the model suggests.
- Let’s take a closer look at Lopez’s analysis of the Lock & Nettleton model, especially in the 2nd half of lopsided games. In the 3rd Quarter, we find that offenses with a model WP of 95% only win about 90% of the time. And offenses with a model WP of 100% (Lopez buckets data points into 5 percentage intervals, so these are likely projections ranging from 97% to 100%) still lose around 8% of the time. Both of these imply that the model under-estimate the trailing team’s (in this case, the defense) actual likelihood of winning by a factor of 2 to 4. In the 4th Quarter the same model flips – it still under-estimates the trailing team’s likelihood of winning, but this time, when the trailing team is on offense. Here, the 5% model WP teams actually win about 10% of the time, and the 10% model WP teams actually win close to 20% of the time.
- Also, in the 4th Quarter only, victory formation plays are included in the data set. I’m not aware of a victory formation ever going wrong in the history of the NFL, so some 100% WPs are in fact, 100%. If those plays were eliminated from the data set, the bucket of 0% WP teams would probably have a higher winning percentage.
- Lopez only analyzed one model, Lock & Nettleton. And it performed better than most during the Patriots-Falcons Super Bowl, never reducing New England’s WP below 1% (100:1 odds). We can’t do the same analysis of the proprietary WP models, but there’s good reason to think those models are more over-confident than Lock & Nettleton at the extremes.
To sum up: for most NFL fans, the only time a WP model is worth talking about is when a team overcomes a huge 95%+ loss probability to ultimately prevail. The model builders might consider extreme situations as "edge cases4," but they are actually the only cases that matter to most observers. And when we inspect the performance of the models at the extremes, we find evidence that they do, in fact, over-estimate the WP of the leading team, especially in the second half. Not just occasionally, but systematically. Further, small errors in a model get amplified at the extreme ends of the curve, so that WP estimates of 98%, 99%, 99.5% may be underestimating the likelihood of a comeback by a factor of 2, 5, even 10. A win probability model that is statistically accurate between 10% and 90% is nice but irrelevant, unless you’re the General Manager of an NFL team or perhaps running a sportsbook.
Additional interesting articles regarding Win Probability, some with quotes from model builders, are at The Ringer, Slate, ESPN and inpredictable.com.
In Part 2, we’ll dive deeper into what some of the flaws are, and potentially, how they can be fixed.
Footnotes
-
Suprisingly, Seattle's peak win probability was not right before the infamous 2nd-and-goal from the 1 at 0:26 that Malcolm Butler intercepted. Because the Seahawks were down by 4 and needed a touchdown, PredictionMachine.com estimated their WP at just 64% (although Andrew Healy makes a good argument it was 87%). According to the model, Seattle's peak WP was at 13:42 in Q4, on offense, leading 24-14. Seattle was above 90% starting from 3:23 in the 3rd Qtr until 8:06 in the 4th, when Tom Brady converted a 3rd-and-8 via a 21-yard completion to Julian Edelman, reaching the Seattle 4. ↩
-
Wondering why Brian Burke and his popular AdvancedNFLStats.com (later renamed AdvancedFootballAnalytics.com) model isn’t on the list? He shut down his site around 2014 and joined ESPN. Although Burke was one of the first to dive into win probabilities (among many other statistical concepts) his WP model was always mostly proprietary, and is unlikely to change at “The Worldwide Leader.” ↩
-
Despite offering in-game wagering on all NFL games, a sportsbook's need for a highly accurate WP model is questionable. The reason is the padding, or safety margin, that books use when setting in-game moneylines. For example, if one team is listed at +400, or 4:1 odds, you can't bet the other side at -400. Some actual examples from the Oct. 4 Sunday Night game between Philadelphia and San Francisco (from FanDuel Sportsbook): Pregame, Philly +270 (implying 27% WP), SF -335 (implying 23% lose probability). Philly's true WP is about 25% according to this model but the book has 2 percentage points of padding around each side. 3rd Qtr: Philly +186 (35%), SF -235 (30%) - now 2.5 percentage points of padding. Early 4th Qtr: Philly, now leading, -188 (34.7% lose pctg), SF +152 (39.7% WP), also 2.5 pct points of padding. Very late 4th Qtr: Philly -1600 (6% lose prob), SF +820 (11% WP), again, 2.5 pct points of padding. Yes, sportsbooks need a model, but they can tolerate some inaccuracy given that the in-game posted odds imply about a 5 percentage point gap between the WP/LP of the two teams. ↩
-
"edge case" example: https://github.com/maksimhorowitz/nflscrapR/issues/129#issuecomment-533577009 ↩